 Application Monitoring software can make the difference between knowing that a server went offline after the fact, and knowing that a server’s disk space has been running out for two weeks, and that URL response to your web-apps has been getting slower and slower.
ManageEngine’s Applications Manager is an application monitoring system that can help you to proactively identify potential application problems, and notify you when unexpected problems happen.
How well does it work? We took it for a test drive to find out.
Let’s start by testing out the main features of the Applications Manager:
Easy Setup
There’s not much to say about setup – it’s quick and easy as you’d expect for a product like this. Suffice it to say, most admins will have no problem installing and configuring the software.
Monitor lots of different apps
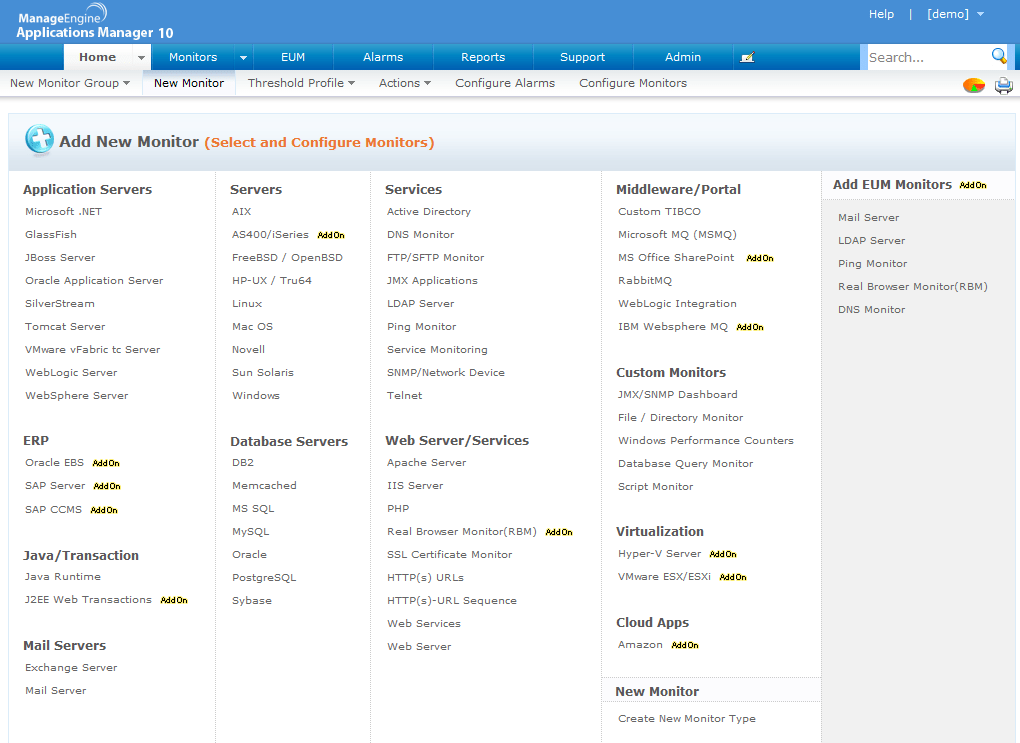
The Applications Manager can manage a wide range of apps. Need to monitor databases? It supports Oracle, SQL, DB2 and others – and can perform custom database query testing. Virtualization? No problem – monitor both VMWare and Hyper-V. Web Servers like Apache and IIS are supported, as are more advanced Website monitoring functions. For example, you can do URL monitoring as well as web content monitoring (alert if a page changes unexpectedly!), and more.
It also can monitor other services like Sharepoint and Active-Directory, Exchange, DNS, and FTP. Add custom application monitoring, SNMP and custom scripting, and you’ve got a very robust package.
Server Monitoring
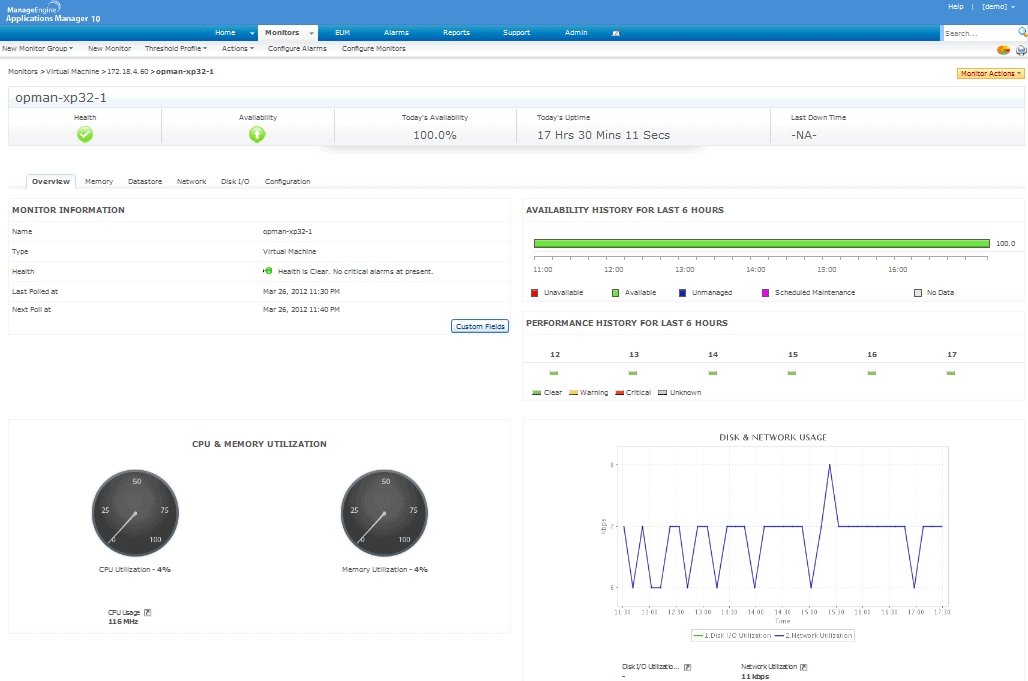
In addition to applications, the tool can monitor most Server OS’es: Windows, Linux, Solaris, HP-UX, Novell and Mac OS are all supported. Server monitoring simplifies management of your hardware platforms. It monitors key performance metrics like CPU, memory, and disk utilization. Alarms and notifications can be triggered if say, CPU usage gets too high, or if available disk space drops.
It also enables capacity planning by providing detailed reporting of past trends. It helps to identify which resources are getting slim, and allows administrators to proactively plan for optimum performance.
Application Monitoring
As you already saw, this product can monitor many different applications. Details on what can be monitored vary by applications, but a few examples include:
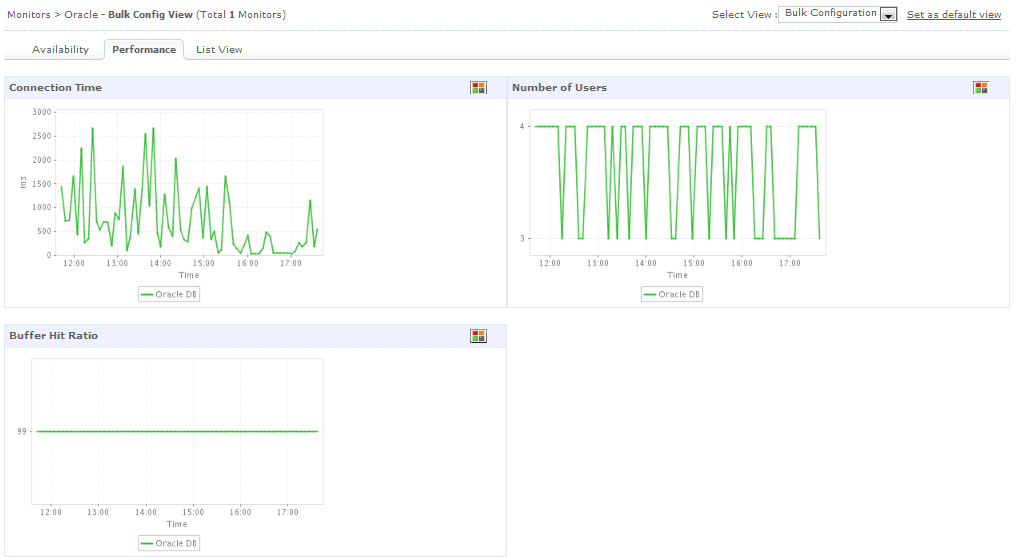
- Oracle and other databases – monitor server response time, connection time, number of users, and more.
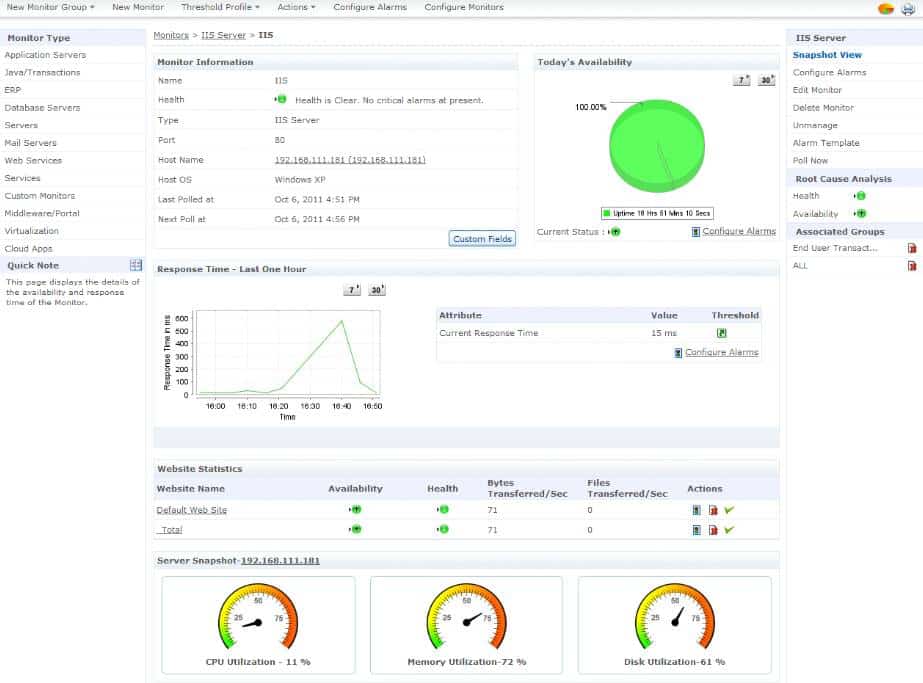
- IIS: Applications Manager can use WMI to query IIS for content statistics and files transferred. It also monitors availability and response time
Group Multiple Monitors for Complete Service Monitoring
The ability to group multiple monitors together is a useful feature. It allows you to define components that deliver business services, group them into a single view, and alert when critical infrastructure components fail. This feature makes it easy to provide a dashboard that can give IT managers an at-a-glance view of critical business services – without having to know the details about which servers are involved in service delivery.
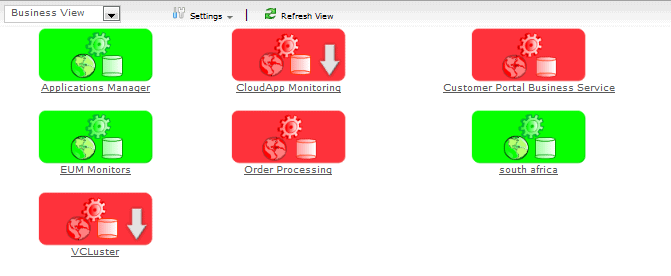
Clicking on a business view drills down to a detailed summary screen. This screen shows summary information about the applications and servers involved in delivering the service. In this screen we can see two database monitors are “critical,” and therefore the service is down.
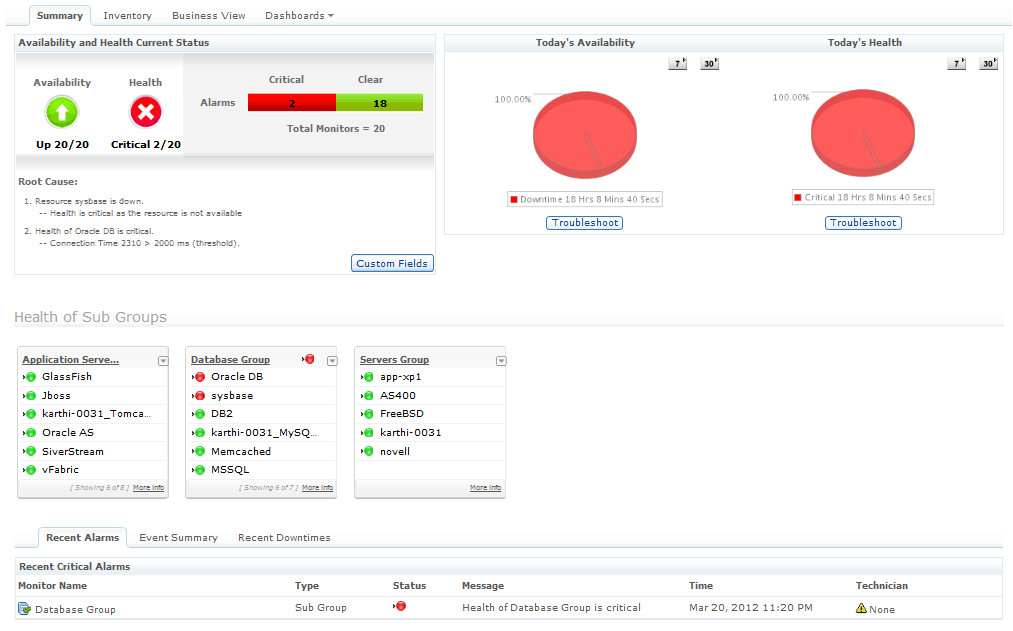
Administrators could drill down further to aid troubleshooting. Clicking on any of the monitors would lead to a detailed status screen for that component. The detailed status screen shows things like recent alerts, events, and performance metrics – all helpful for identifying the root cause of problems.
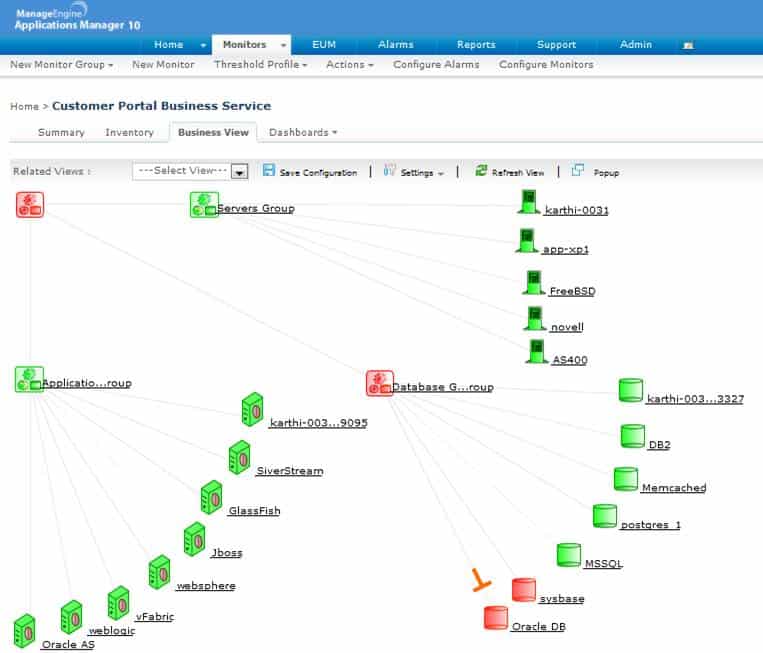
Clicking on the “Business View” tab shows a visual map of all monitors that make-up the application. This screen also shows status of the components – again showing us the failed databases. Just like the summary screen above, clicking on a component leads to a detailed drill-down screen.
End User Experience Monitoring
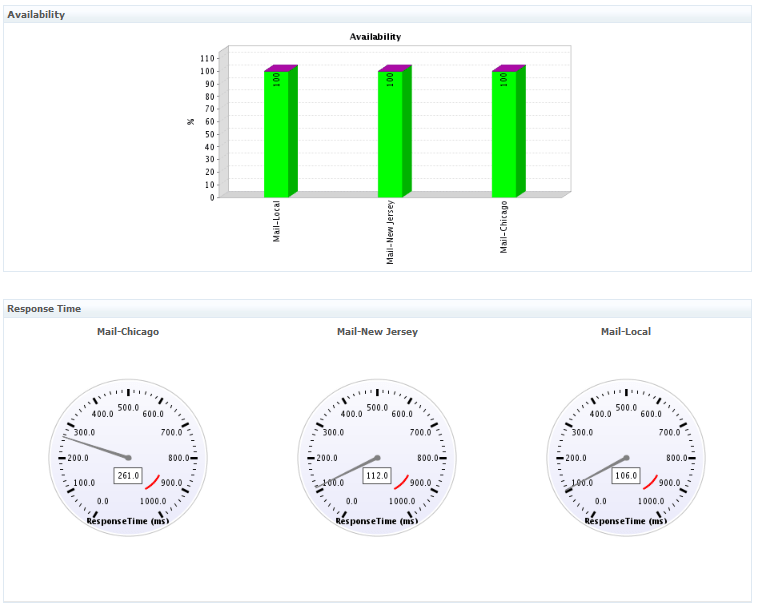
End users in remote offices often have a far different opinion about how fast IT services are, compared to head-office staff. ManageEngine has a way to monitor and report on the end-user experience. An agent is installed at a remote location, and configured to monitor key services like DNS or file-server response time.
The end-user monitor reports back on service characteristics for the remote offices, shown side-by-side with local performance stats. The tool make it easier for administrators to understand how applications perform over the WAN, and helps them to detect performance problems, giving confidence that the IT infrastructure isn’t the cause of productivity problems.
The only downside to this approach is the requirement to install agents – which by their nature require administrators to have target workstations available at their remote offices. It also means that the workstation and agent must be maintained, patched, and supported – adding to overall IT complexity. Finding spare hardware can be a challenge for many cash-strapped IT departments, but the insight that this tool provides into your wide-area network could be well worth the trouble.
Fault Alerting
Applications Manager wouldn’t be complete if it didn’t generate alarms and notifications of trouble. Notifications and other actions are triggered whenever a monitored application crosses an administrator-defined threshold – send email, run a script or program, or other action.
There’s also a useful Alarm view that provides a fast way for admins to identify active alarms. It provides an instant view of critical problems, and warnings that could become bigger problems. You can also use this view to drill down and view details on components in trouble.
Alarms can be configured with multiple thresholds. For instance, a CPU “warning” can be triggered when the utilization goes over 75%, then it can be cleared again when it drops. And, a “critical” alarm can be triggered when the CPU hits 100%. This should be a must-have feature for every monitoring system. It helps admins to identify potential trouble areas without the urgency associated with a critical alert.

Reporting
The reporting engine has a wide range of reports available covering things like:
- Availability reporting
- Application session details
- Summary trend reporting
- Web service health reports
- TopN reports
- And many others
Reports can be scheduled to run at specific times, or run ad-hoc with custom date and time parameters.
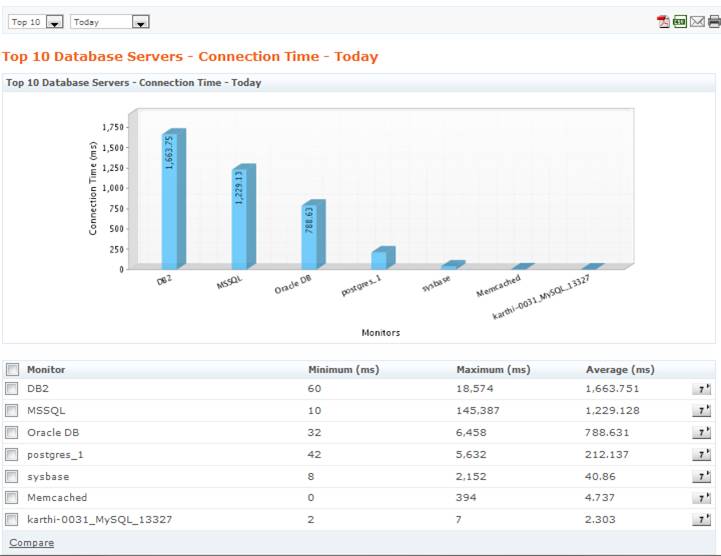
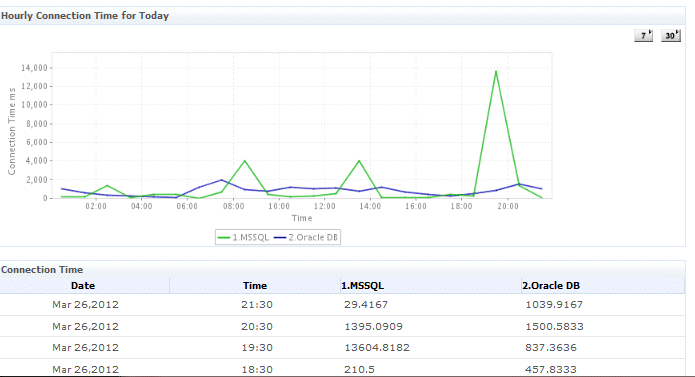
Comparisons can be generated by selecting at least two applications from the list, then selecting “Compare.”
Pricing and Editions
Applications Manager is priced per Monitor required. Monitors are required for each specific application, server, or service being monitored. A Windows server would require one monitor, and another would be required to monitor Apache running on that server. In addition, various add-on monitors are available at extra cost – such as the End-User Monitor that we covered earlier.
Most users will probably want the “Professional” edition, which includes most of the features reviewed here. Larger enterprises would want to consider the “Enterprise” edition of Applications Manager, which can support 250 or more monitors. It’s scalable, can be distributed geographically, and supports a fail-over redundancy for higher availability.
Cost for the Professional edition of Applications Manager starts at around $750(USD) for 25 monitors, but pricing varies based on the numbers of users accessing the web-client. More pricing information can be found on ManageEngine’s site.
Summary
Overall, the Applications Manager is a great tool that will help any business manage their applications and business services better. It is packed with capability, easily monitoring some of the most popular – and even some of the more obscure applications around.
Faults with this package are few. The UI is mostly easy to use. The navigation bar is a little odd the way it has a lower ribbon bar that doesn’t ever change to match the context of the main bar above, but it’s functional. The only other complaint is that I couldn’t find an easy way to access SNMP trap information sent from servers – but it’s probably there somewhere. [Note:ManageEngine contacted me to point out that SNMP traps can be monitored as long as “SNMP Trap Listeners” are configured.]
For such a well-priced product, the Applications Manager has a ton of features. If you’re looking for better application management then it’s well worth a second look. Try it out with a free 30-day trial download, or check out the LiveDemo environment.
Product: ManageEngine Applications Manager
Review Date:
Rating: 4 


Pros:
- Monitor tons of applications
- Track unauthorized website changes
- Group apps for efficient total service monitoring
- Well priced
Cons:
- UI has some oddities
- End-User-Monitoring requires agent
- SNMP traps hiding?
ManageEngine Applications Manager FAQs
What types of applications can ManageEngine Applications Manager monitor?
ManageEngine Applications Manager can monitor a wide range of applications, including web applications, databases, servers, and cloud-based applications.
How does ManageEngine Applications Manager work?
ManageEngine Applications Manager works by using a variety of monitoring techniques, including application profiling, code-level diagnostics, and log file analysis, to collect data on application performance. This data is then used to identify issues, troubleshoot problems, and optimize application performance.
How does ManageEngine Applications Manager integrate with other ManageEngine solutions?
ManageEngine Applications Manager can integrate with other ManageEngine solutions, such as ManageEngine OpManager for network performance monitoring and ManageEngine ServiceDesk Plus for IT service management. This allows organizations to create a more comprehensive IT management solution.
Does ManageEngine Applications Manager offer mobile access?
Yes, ManageEngine Applications Manager offers mobile access through its mobile app, which is available for iOS and Android devices. The app allows users to view real-time application performance data, receive alerts, and troubleshoot issues from their mobile device.
How does ManageEngine Applications Manager help with capacity planning?
ManageEngine Applications Manager can help with capacity planning by providing insights into application usage patterns and trends over time. This information can be used to identify areas of over or under-utilization, and to optimize application infrastructure for better performance and cost efficiency.
What types of deployment options are available for ManageEngine Applications Manager?
ManageEngine Applications Manager can be deployed on-premises or in the cloud, depending on an organization's specific needs and preferences. Cloud deployment options include Amazon Web Services (AWS), Microsoft Azure, and Google Cloud Platform (GCP).
How does ManageEngine Applications Manager help with troubleshooting application issues?
ManageEngine Applications Manager helps with troubleshooting application issues by providing real-time visibility into application performance, including detailed metrics on response times, throughput, and errors. The solution also includes code-level diagnostics and log file analysis capabilities, which can help identify the root cause of complex application issues.

