Free tools are among my favorites, especially when they also do cool things. So, when SolarWinds released their Network Device Monitor. I was excited to see what it can do.
As it turns out, it’s a pretty useful tool. The Network Device Monitor can monitor any single device on your network using SNMP. It will monitor any SNMP variable on that device – so for instance you could monitor bandwidth use on your routers, or disk space on your servers. Thresholds can be configured that will notify you of warnings or errors.
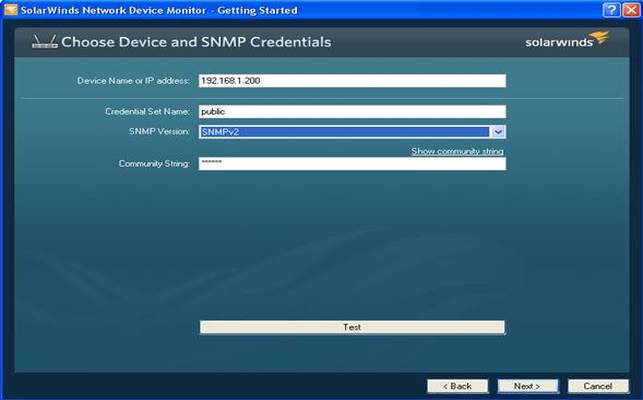
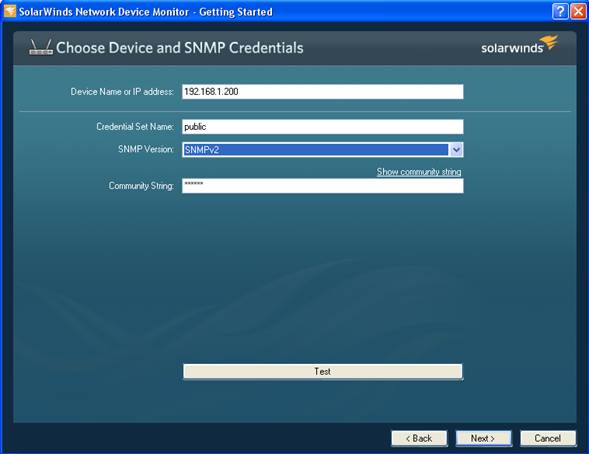
Installation is fast, and setup-screens help configure the Monitor. First up: configuration of the device name or IP that will be monitored, as well as SNMP version and community string. The Network Device Monitor supports SNMP versions 1, 2c, and 3, so security options can be configured at this point.
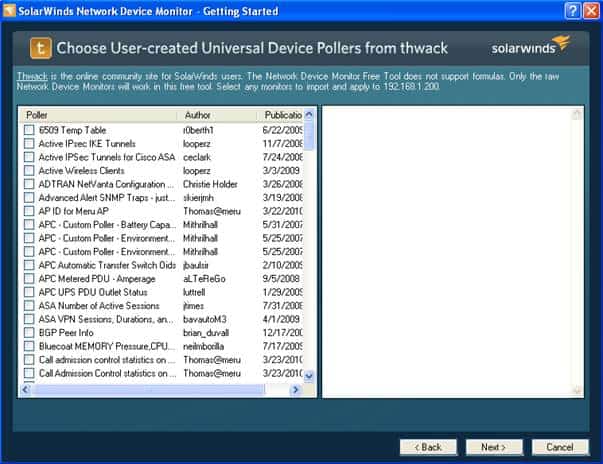
Next, you have the option of choosing what information you’d like to monitor, using what SolarWinds calls a “Universal Device Poller” or UDP. You have three options here – use the built in UDPs, use a UDP from the Thwack content exchange, or build your own.
The built-in UDPs are pretty skimpy, so the best bet is to use Thwack or build your own poller. Fortunately, SolarWinds has done a great job of making this painless. The tool is perfectly integrated with Thwack, and choosing that option presents a list of hundreds of user-generated UDPs. Just browse for one that looks like it will work for you, select it, and hit next. You can then test it out to confirm that it works with your system.
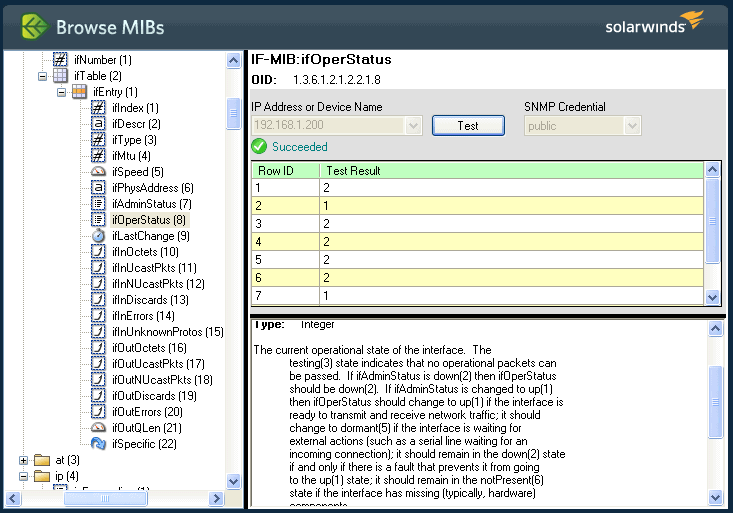
Choosing to build your own UDP will launch the MIB browser. Browse through the tree to find the objects you want to monitor, then use the “Test” button to confirm that your device supports that object. The tool also includes a MIB compiler, so you can load MIBs provided by your hardware or software manufacturer.
Ways to Use the Network Device Monitor
Here are a couple of examples of what the tool could do for you. Let’s say you had an important router with a number of servers behind it. The Network Device Monitor could watch all interfaces on the router to show if they are in an Up or Down state. Down interfaces are indicated with a red status light, and a text description of the status.
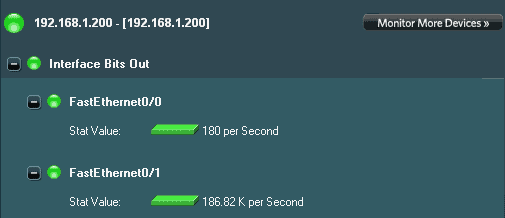
Or, you could monitor an interface for bandwidth use. In the example below, I set a threshold so that exceeding 250Kb caused an alarm. You can see the status light for FastEthernet 0/1 changes to red once the threshold is exceeded. Network Device Manager excels in ad-hoc monitoring scenarios like this.
The only real problem with the tool is that it can only monitor a single device. Because of this, the Network Device Monitor has limited real-world application. But, even with that limitation I can still think of many uses. It’s also a great introduction to the more advanced features found in SolarWinds Network Performance Monitor – the next logical step up. (Recently reviewed here)
It also helps to have some basic knowledge of how SNMP works if you plan to build a custom UDP. Importing MIB files and finding Object IDs is not difficult, but understanding the results can be complicated. If your SNMP skills are a little rusty, you may want to check out our tutorial on SNMP basics to help you get started.
The Network Device Monitor is a great addition to the selection of free tools SolarWinds offers. Though it’s clearly designed to promote their full network monitoring systems, it stands on its own as a useful tool that can help you manage your network. You can start with a 30-day free trial.
Rating: 


