Lets start by highlight a few of the key newer features:
- Native Hyper-V monitoring for virtualized Microsoft Infrastructure
- Newly re-vamped and streamlined UI
- Including cleaner dashboard views
- Very brief and easy read device information cards
- Enhanced map creation from both a Layer 2 & Layer 3 perspective
- These map are created automatically, simply enter a subnet or setup a seed device and let it run
On top of these newly added features What’s Up Gold does much more than performance management, it is a much more all encompassing solution providing the following:
- Traffic Analysis via Netflow statistics: Including jFlow, sFlow, Netflow v1, 5, 9, IPFIX, and Netflow Lite. Along with IPv6 support which is pretty huge as IPv6 becomes more and more prevalent
- Network Configuration Management: Configuration backup and archival, along with task automation and compliancy reports
- Wireless Management across multiple different vendors such Cisco (including both AireOS and IOS-XE based WLC’s), Ruckus, Mero, & Aruba
- Enhanced monitoring of virtualized environments: Including support for both VMWare and Microsoft Hyper-V
The first thing existing What’s Up Gold users will notice is brand new slick UI interface.
With this large overhaul you would think the new UI would be confusing and dis-organized but I can safely say it is anything but.
Now, it does take a little getting used to but once you start clicking around and getting familiar with where everything is it becomes much easier.
The UI can be customized quite easily, on the right hand side of many screens you will have the option to ‘Add Reports’ within that section you can choose from a host of many different monitors and statistics that you can add to the screen to help with isolated faults or determining overall device health quickly on a single panel.
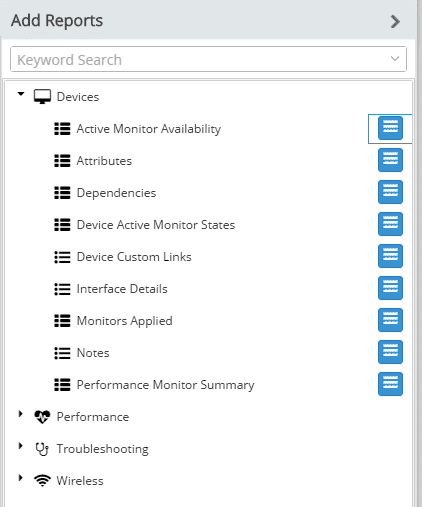
Just a few of the many reports you can add to device windows.
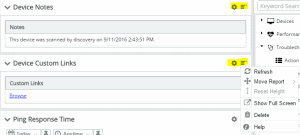
You also have the freedom to re-arrange and change all the existing panels within the device, by clicking on the gears within the top right corner of each panel. I personally find all the individual panel settings tend to add a little clutter to the window as a whole but once you get used to seeing them all over the place you tend to start overlooking them quickly.
Now, that we know what the new What’s Up Gold can do and what it looks let’s take a peek at how it works.
Well the first thing I noticed that makes What’s Up Gold different then let’s say SolarWinds is how devices/nodes are managed and monitored.
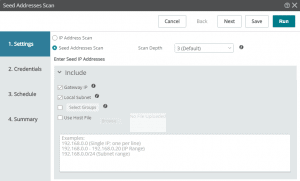
The application starts by welcoming you with a dialog window asking you to enter subnets or seed devices to begin discovering your network.
That is how you add nodes to be monitored by What’s Up Gold, you can add individual IP’s but trust me when I say it is much easier to enter a subnet or seed device and letting the system scan for available devices to monitor.
Below is the window used to configure a network scan with What’s Up Gold, this is also the same window that greets upon a fresh installation:
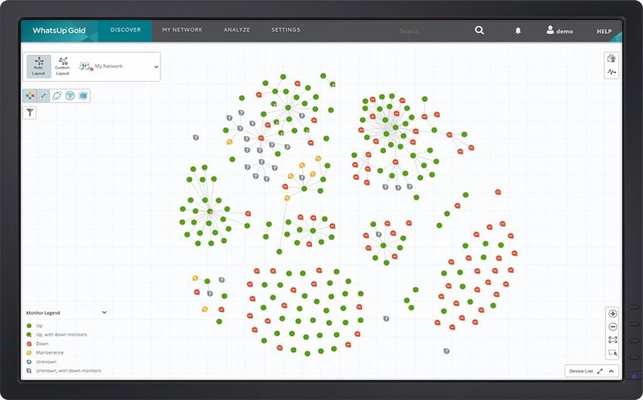
Now, that we have a scan running we will start to see our network start populating on the map, while the scan commences you will see the map continue to grow and form dynamically connecting end points to switches and switches to routers as MAC and ARP tables are gathered from the discovered devices.
From the devices discovered, you can then pick and choose what devices you want to monitor in a deeper fashion (IE: CPU/Memory, Configuration, Interfaces, etc) as well as assigning devices to a specific group so you can easily categorize and separate certain devices.
The network map itself that is generated certainly is a nice high level document providing you the ability to customize the layout, I just wish it had the ability to export into a Visio format so the map can stored with other network diagrams.
The nice piece however, is that the map is interactive by selecting one of your devices on the map you will be presented with a very brief summary the device in question:
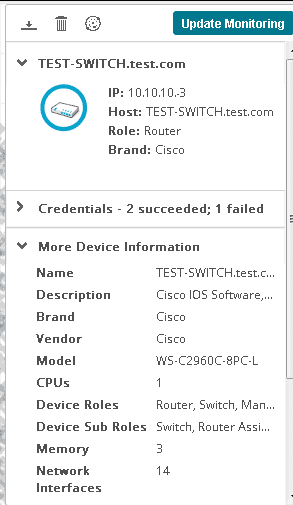
Device Card seen from the map
By clicking on the device again you will taken away from the map view and into default device page where you will be able to see all the device details (Interface, CPU / Memory, and any specific monitors that are configured.
Due to this interactive nature, the map also makes it very convenient to zero in on devices that are in distress with monitors that are down or unavailable.
This paired up with the device summary mentioned above provides you the ability to see what is going within a single pane of glass eliminating the need to play ‘hide and seek’ by means of clicking between windows similar to other network monitoring tools.
The mapping also goes above and beyond the typical wired network by also mapping wireless and virtualized devices as well, now you might think this could make the map quite cluttered but What’s Up Gold is smart enough to know the difference between Wireless, Virtual, and physical devices.
These different devices can be toggled on or off using the ‘Overlay’ buttons in the top left corner of the mapping window.
One overlay I would like to see added in the future, would be an overlay for client devices by end users.
Seeing your entire network is great but when you network sections containing hundreds of users things can get interesting from a visual perspective.
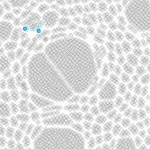
Large network scan reminds me of a brain. This scan contains 100’s of nodes across multiple locations.
What’s Up Gold also has a host add-on’s at it’s disposal one of these is configuration management. It’s safe to say every Network Management Server should contain some level of configuration management nowadays, long gone are the days when only performance management would get you by. The configuration management piece of What’s Up Gold provides many different services:
- Configuration backup
- Firmware management and updates
- Configuration compliance enforcement
- Trigger-able alerts based configuration changes or configuration job status
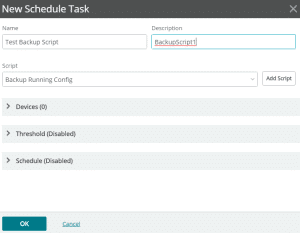
Many of these can be configured via the Task Library section with the settings menu, this is where we would specify the task to be run and what schedule we want to apply to this specific task.
Once we have the tasks running properly and pulling information into What’s Up Gold we can see this information directly from the device page itself.
From there will be able to view the configuration, and even run configuration comparisons against previous versions of the device’s configuration.
We can also go as far as to compare the device configuration again the configuration of other devices, this can be surprisingly helpful if you have devices with similar functions with almost identical configurations (Barring IP addresses, routing configurations, hostnames, etc)
The final rundown
The new version of What’s Up Gold certainly does make it much more aesthetically pleasing than its predecessor, and the new streamlined mapping utilities certainly do help with analyzing and quickly diagnoses network issues.
The new automatic mapping system certainly is impressive and the high level view is just about perfect for some large NOC monitors.
With that said however, I feel What’s Up Gold is ideal for a small to medium size business the mapping and group functionality are perfect for sites with a few dozen to a hundred devices.
Going above that I feel will take away from the simpleness and helpfulness that is provided by the map.
Now, don’t let that sound discouraging as mentioned What’s Up Gold is an all encompassing product providing both performance and configuration management, extending from your physical network down to your wireless and virtual network.
